- EnerWrap
- Posts
- U.S. Oil Production Monthly
U.S. Oil Production Monthly
Growth Continues
Jeff Davies
August 16, 2024
Highlights:
Weekly U.S. oil production data showed U.S. at an all-time high. We look at the most recent monthly data below.
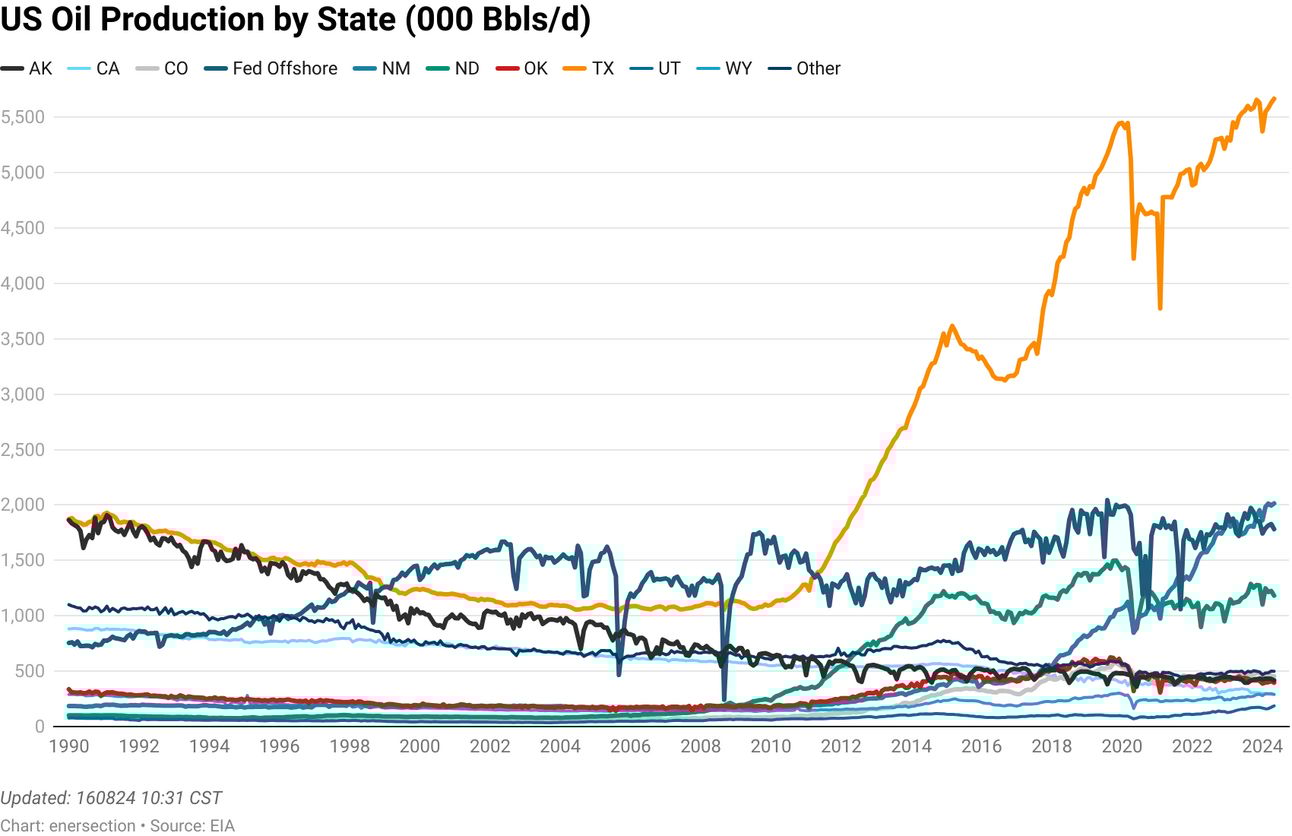
U.S. oil production as of May was 13.18 million barrels per day, up 3.5% versus last year. The current streak of monthly year-over year growth stands at 21 months, the third longest stretch behind 56 months from 2011-2015 and 38 months from 2016 to 2020.
At 5.67 million barrels per day, Texas represents 43.0% of total U.S. oil production. It is worth noting that there is no significant Federal acreage in the Lone Star state, it is virtually all privately-owned lands.
The Federal Gulf of Mexico offshore region was 13.5% of U.S. production in May while New Mexico (largely Federal leases) registered at 15.3%.
These three areas combined totaled 71.8% of U.S. oil production.
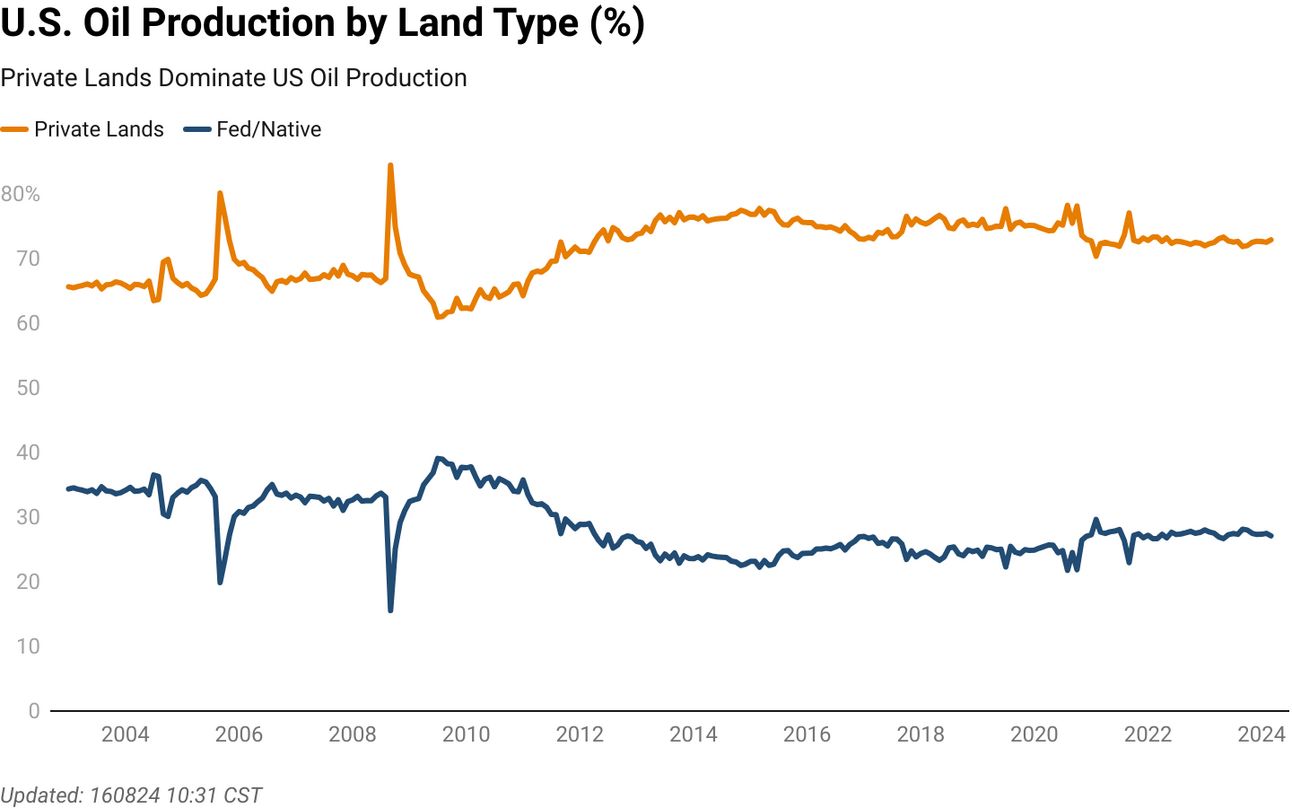
EnerWrap uses Department of Interior monthly data combined with EIA monthly data to show U.S. oil production by land type on the next two pages. The DOI data is as of March.
During March private lands represented 72.9%, Federal offshore 13.8%, Federal onshore 11.9% and Native lands were 1.5%.
Private lands produced 9.60 million barrels per day while Fed Offshore & Onshore produced 1.82 million barrels per day and 1.56 million barrels per day, respectively.
Year-over-year growth was 3.3% on private lands, -3.6% on Gulf of Mexico Fed leases and 8.6% on Federal onshore leases.
Subscribe for the full report
Subscribe to EnerWrap Premium Plans to read the rest.
Become a paying subscriber of EnerWrap Premium Plans to get access to this post and other subscriber-only content.
Already a paying subscriber? Sign In.
A subscription gets you:
- • Daily, weekly and monthly reports
- • Ad-hoc topical energy posts and archives
- • Post comments and join the community